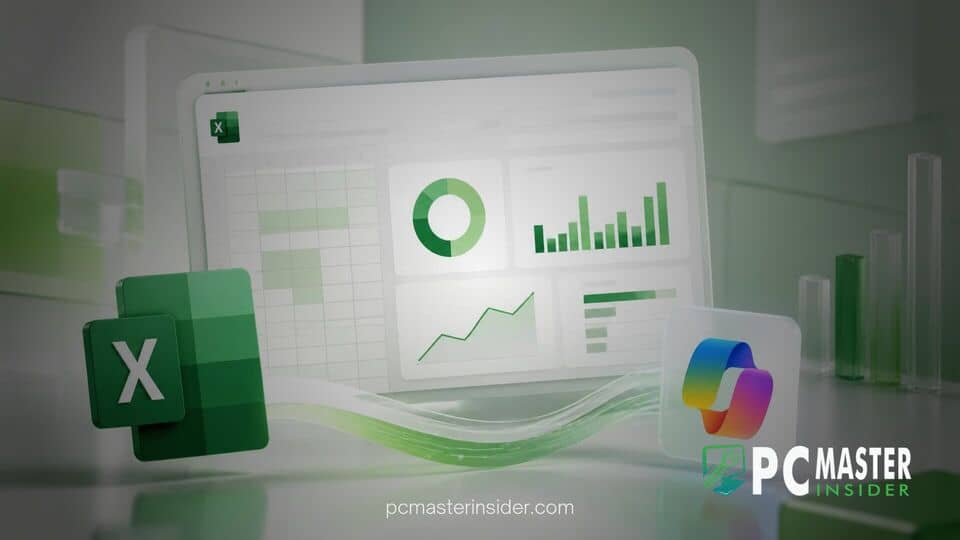
Microsoft has officially begun rolling out Excel Canvas, a new Copilot capability designed to automatically convert complex spreadsheet data into interactive, visual reports. The feature builds dynamic dashboards complete with charts, key metrics, and narrative summaries that stay synchronized with underlying workbook changes.
By shifting from static charts to an intelligent, auto-refreshing report view, Microsoft aims to eliminate the manual labor traditionally required to assemble recurring business summaries. Users can refine layouts, adjust axis parameters, or filter specific metrics using straightforward natural language prompts within the Copilot interface.
Microsoft Excel Canvas Copilot Reports Deliver Dynamic Spreadsheet Visualizations
The introduction of microsoft excel canvas copilot reports marks a significant evolution in how enterprise users interact with financial models and operational datasets. Rather than manually generating individual PivotTables and formatting chart blocks, users can prompt Copilot to generate a unified reporting canvas. This view aggregates primary performance indicators into a presentable layout suitable for executive updates and team briefings.
Introducing Excel Canvas for Copilot
Excel Canvas serves as an dedicated presentation layer built directly into the spreadsheet application. When activated, Copilot evaluates the structured tables and range selections inside a active workbook, automatically identifying primary metrics, trends, and outliers. It then constructs a balanced visual panel containing KPI cards, bar graphs, trend lines, and contextual text summaries.
This automated layout creation removes one of the most persistent hurdles in corporate administration: translating dense numerical tables into legible presentation decks. Instead of copying data across disparate office tools or building custom macros, users receive an instant visual draft that highlights essential business signals without leaving the spreadsheet interface.
Dynamic Data Visualizations and Real-Time Refreshing
A core foundation of the Excel Canvas framework is its live connection to the source workbook. Traditional charts often require manual range adjustments or formula repairs when new monthly entries or operational rows are added. In contrast, an Excel Canvas report updates automatically whenever underlying cells, linked database queries, or pivot source tables are altered.
Users maintain full conversational control over the generated view. If an initial graph selects an inconvenient scale or omits a crucial sub-category, the user can type plain-language instructions such as "switch to a quarterly breakdown" or "highlight margin changes in red". Copilot reconfigures the affected elements instantly while keeping the remaining dashboard structure intact.
This real-time responsiveness aligns with Microsoft's broader strategy to integrate ambient AI capabilities across its desktop suite. As part of this platform-wide push, Microsoft has also worked to streamline OS recovery options by adding a Cloud Rebuild recovery option to Windows 11 Settings, alongside continuous enterprise management upgrades.
Licensing Requirements and Deployment Rollout
Microsoft is staggering the worldwide release of Excel Canvas throughout October 2026 across targeted distribution rings. According to deployment notices sent to Microsoft 365 tenant administrators, the rollout requires no special administrative toggles or tenant configurations to take effect.
Access via Microsoft 365 Copilot and Excel Web
The feature is accessible on supported spreadsheet platforms for accounts with active Copilot licenses:
- Supported Platforms: Microsoft Excel for Windows desktop and Excel on the web.
- Licensing Requirements: Requires an active Microsoft 365 Copilot license or individual Copilot Pro subscription with Excel integration enabled.
- Administrative Impact: Zero tenant-level compliance or policy adjustments are mandated prior to general availability.
While the feature accelerates dashboard assembly, enterprise data analysts recommend auditing initial automated calculations. Because generative models select display metrics programmatically, users should verify underlying ranges before exporting or presenting automated reports to key stakeholders.
Microsoft's ongoing enterprise updates span beyond spreadsheet tools. For example, IT administrators managing organizational hardware should note that Windows 11 24H2 Home and Pro editions reach end of updates on October 13, making current system updates essential for enterprise compliance.
Future Outlook for Copilot Productivity Features in Office
The addition of Excel Canvas reflects Microsoft's commitment to making generative AI act as a collaborative co-worker rather than a passive search assistant. By shifting Copilot from answering isolated queries to managing dynamic document views, Microsoft is setting a benchmark for future productivity tools.
In addition to core productivity enhancements, Microsoft continues to refine its underlying application infrastructure. Recent efforts include issuing framework updates to fix WinUI 3 memory leaks in native Windows 11 apps, ensuring robust system stability as cloud-connected features grow more resource-intensive.
As Excel Canvas reaches general availability by late October, business users can expect significant time savings on recurring reporting cycles. While human oversight remains necessary to validate visual assumptions, the ability to turn raw spreadsheet data into live, auto-refreshing reports represents a major shift in enterprise data workflow automation.